Performance
Part of Optimising a native advertising campaign
Comparing placement performance at a useful sample size
Set a decision threshold, compare like placements and keep small native placement samples labelled inconclusive.
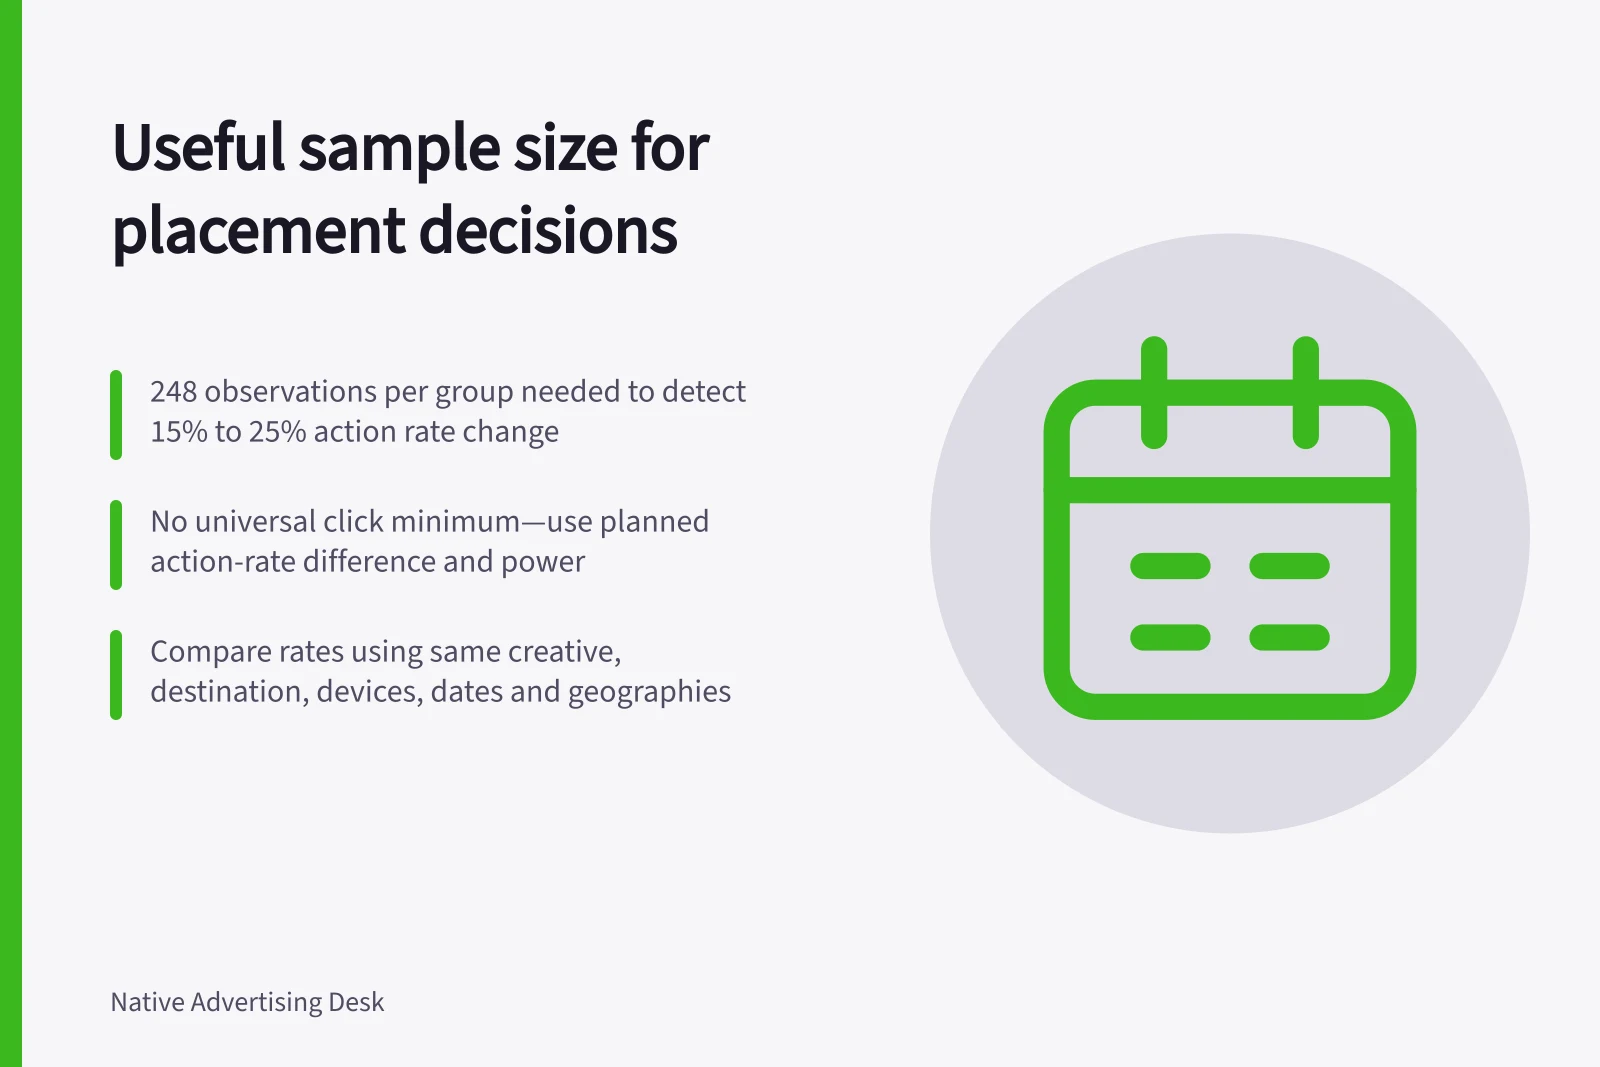
For native placement decisions, a useful sample size is a planned number of comparable arrivals per placement, not a universal click minimum. Set the smallest worthwhile action-rate difference, expected rates, confidence, power and group allocation before reviewing results. A worked example requires 248 observations in each group to detect a rate change from 15% to 25% at 95% confidence and 80% power.
Define the comparison before sorting rows
Choose an outcome that matches the campaign's purpose: a qualifying article visit, an eligible enquiry or another specified action. Apply the same counting rule and observation period to every placement. Keep spend, clicks, recorded arrivals and outcome counts beside each rate. A placement with no recorded actions may still have too little exposure to judge.
Check what each placement row represents. If a label does not identify the section represented, clarify it before comparing rows. Record any comparison the available export cannot support.
Before comparing sections, confirm they ran the same creative and destination on similar devices, dates and eligible geographies. If one mainly received a different creative, do not credit a raw rate difference to placement alone.
Calculate the action rate as recorded outcomes divided by recorded arrivals. Keep both counts visible for each placement; the arrivals are the sample-size denominator, not the outcome count.
Decide whether the volume is useful
There is no universal minimum click count. First choose the smallest action-rate difference that would justify changing delivery, estimate the two placement rates and decide how much risk of a mistaken decision is acceptable. Use comparable recorded arrivals in each placement as the sample.
For equal-sized groups, the two-proportion planning formula is n = [(Z_(α/2) + Z_β)^2 × (p1(1−p1) + p2(1−p2))] / (p1−p2)^2 per group. Here p1 and p2 are the expected rates; set confidence and power before calculating. A worked example uses 15% and 25%, 95% confidence and 80% power: 248 observations per group, or 496 altogether, are required to detect that 10-percentage-point difference.
Treat 248 per group as an example, not a default for every campaign. Epitools’ sample-size calculator for a significant difference between two proportions takes the expected rates, confidence, power and ratio of group sizes as inputs; it defaults to a two-tailed test. For unequal placement volumes, calculate using the planned ratio rather than applying the equal-group count.
A one-proportion sample-size estimate does not establish the required count for comparing two placement rates. The pairwise calculation must use both expected rates and the smallest worthwhile difference.
A planning count sets the sensitivity of the comparison; it does not prove that a placement will perform as expected. Once the planned volume is reached, assess the observed rate difference and its uncertainty against the pre-set worthwhile difference. If the comparison does not support the delivery decision, mark it inconclusive.
If volume is too low, extend the observation period where conditions remain comparable, combine only genuinely similar sections under a rule set before reviewing outcomes, or make a small reversible allocation change if waiting is costly.
There is no default pooling rule. Set eligibility in advance; require comparable creative, destination, devices, dates, geographies and outcome definitions; then pool outcome counts over pooled arrivals rather than averaging section rates. Do not merge unlike placements merely to obtain a larger denominator.
Act at the narrowest useful level
A performance-based exclusion needs more caution than a small reversible allocation change. Assess a persistently weak section at that level before changing delivery across a whole publisher, and check the account and bid mode before acting.
Compare the rates and their uncertainty with the pre-set difference that would justify a change. If the planned volume or comparable conditions are missing, keep the result inconclusive rather than treating a rate difference as actionable.
Record the comparison group, counts, periods, creative and page versions, uncertainty and chosen action. Review useful outcome volume after a change as well as the rate. A cleaner average is little help if it removes the readers the campaign was meant to reach.